Understanding Process Drift in CNC Machining
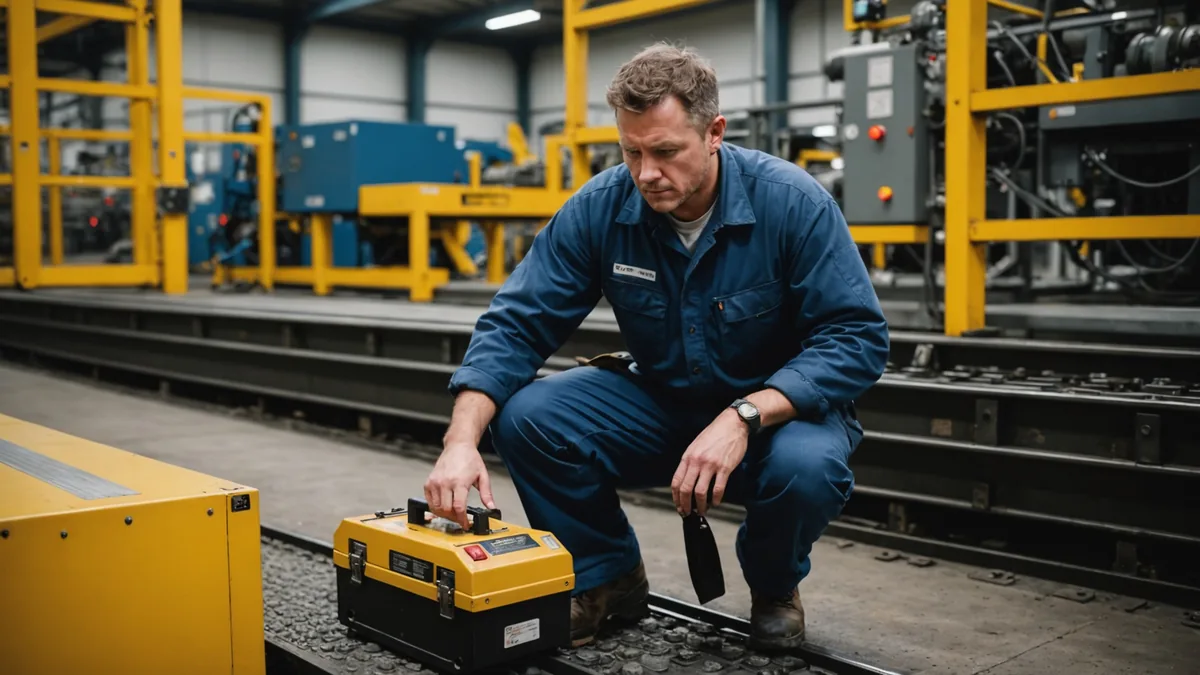
Process drift is gradual. That's exactly what makes it dangerous. A spindle temperature that climbs 2°C per hour, a fixture that wears 3 microns per batch, a coolant concentration that drops 0.5% each shift: none of these trigger alarms. Each reading sits inside its nominal band. But over two shifts, or ten, the accumulated deviation can push a part from in-spec to reject. We've seen this pattern more times than we can count on precision machining lines in Japan, and the consequence is always the same: a scrap spike that looks like it arrived out of nowhere.
What Process Drift Actually Is
Drift is distinct from sudden fault. A broken tool produces an immediate, detectable signal. Drift is the quiet accumulation of small deviations that individually fall inside SPC control limits but collectively push the process mean toward, and eventually beyond, specification boundaries.
In statistical terms, you're watching a shift in the process mean (μ) without a corresponding alarm in your Western Electric rules, because each individual sample looks fine. The Xbar-R chart doesn't flag anything. The operator certifies the shift. And three batches later you're looking at a Cpk that dropped from 1.6 to 0.9 without anyone noticing the transition.
This is the gap traditional SPC wasn't designed to close. It was built for sudden shifts and outlier detection. Slow-moving drift below the control-limit threshold passes through undetected.
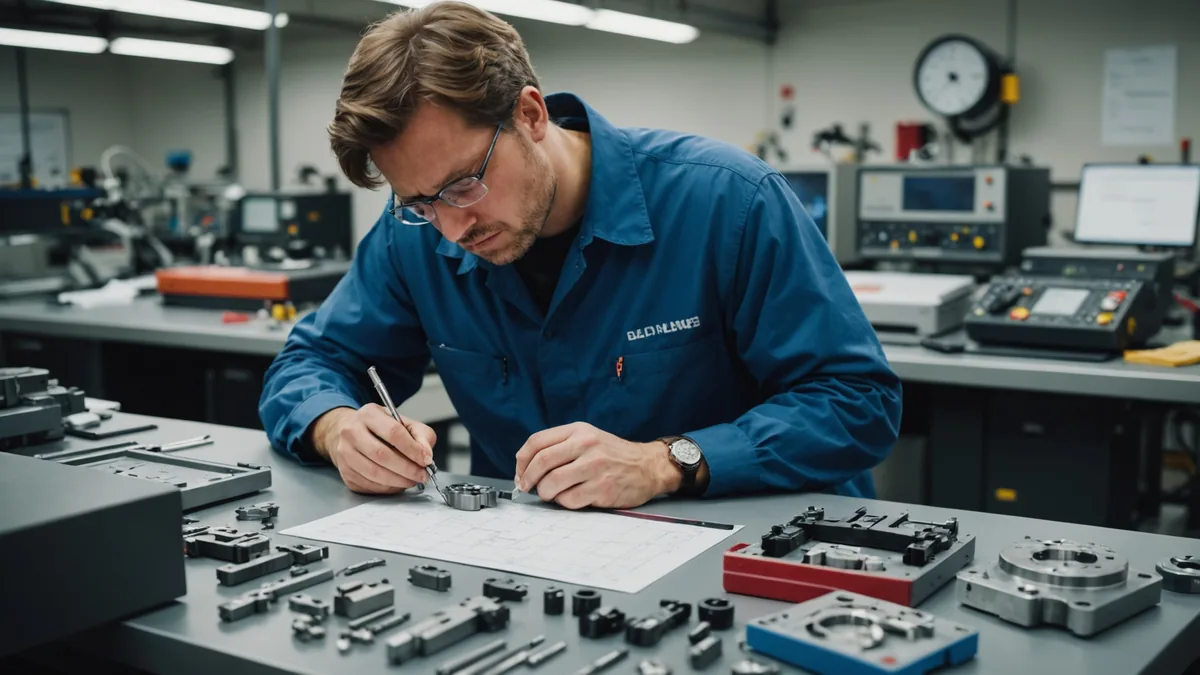
Root Causes: Four Mechanisms Worth Understanding
In our work with mid-size machining operations, four root causes account for roughly 80% of confirmed drift events.
Tool wear is the most common. A carbide end mill cutting 6061 aluminum starts losing its edge profile around 45-60 minutes of contact time at typical feed rates. The cut geometry shifts incrementally. Surface finish degrades before dimensional tolerance breaks, which is why inspection intervals based on dimensional checks alone miss early-stage wear drift.
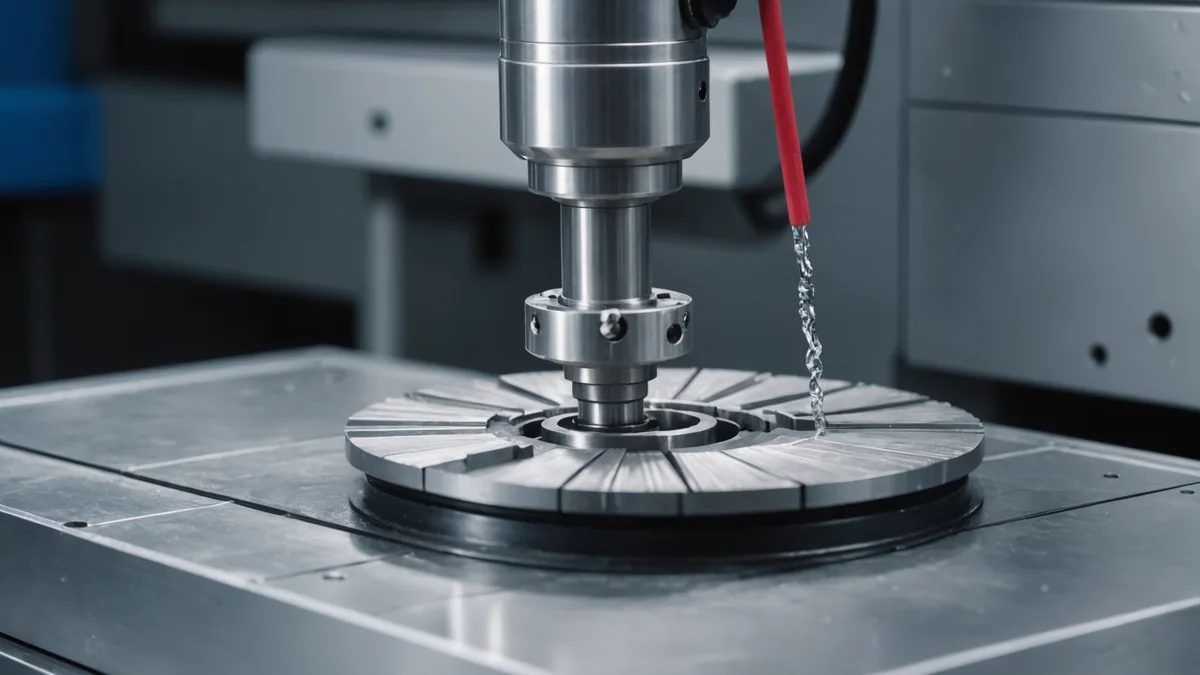
Thermal expansion is the most underestimated. A CNC machining center spindle running at 12,000 RPM generates enough heat to elongate the spindle shaft by 15-25 microns over a 2-hour warmup period. Most operators run warm-up cycles, but we've found that actual thermal stabilization time varies considerably by ambient temperature, spindle load profile, and coolant flow rate. A machine calibrated at 18°C behaves differently on a July afternoon when the shop floor hits 29°C.
Fixture wear accumulates quietly. Locating pins, clamp pads, and datum surfaces all wear at rates determined by the material being clamped and cycle counts per shift. In our tracking across multiple lines, fixture-related positional shift accounts for approximately 15% of drift events but generates a disproportionate share of customer escapes, because fixture wear affects every part in a batch equally. Systematic deviation, not random variation.
Coolant degradation is often overlooked entirely. Coolant concentration, pH, and bacterial load all drift between maintenance cycles. Concentration below the recommended range changes lubricity and thermal transfer, which affects both surface finish and chip evacuation. A 2% concentration drop is invisible in most monitoring setups. Its effect on part quality is not.
Detection: Control Charts vs. ML Anomaly Detection
There are two fundamentally different approaches to catching drift, and they're not mutually exclusive.
Classic SPC control charts work well for high-volume, repetitive processes where you have enough sampling density to apply run rules. A 7-point trend heading in one direction is a signal, even if no individual point crosses 3-sigma. The limitation is that traditional SPC requires a human to look at it, interpret the trend, and act. In most shops we've worked with, charts are reviewed at shift end. By then, 8 hours of drift may already be embedded in 500 parts.
ML-based anomaly detection changes the response time equation. Models trained on historical in-control data can flag deviations in near-real time, triggered not just by dimensional readings but by the multivariate signature of the process: spindle load, vibration spectrum, coolant temperature, feed motor current, and part measurement data all correlated simultaneously. A single sensor reading might look normal; the combination of rising spindle load, falling coolant temperature, and a 4-micron rightward bias in part diameter is the fingerprint of thermal drift with restricted coolant flow.
We've seen properly tuned ML anomaly detection catch thermal drift events 45-90 minutes before they would have produced a first out-of-spec part. That's the difference between a toolpath adjustment and a scrap event.
Important caveat: ML detection is not a replacement for engineering judgment. A model that flags anomalies without categorizing their probable cause requires a skilled operator to interpret every alert. In our experience, the best implementations pair automated detection with a library of named drift signatures, so when the model fires, the operator sees "Probable thermal drift: check coolant flow and spindle warmup status" rather than a generic alarm number.
The Cost of Undetected Drift
Let's put numbers on it. Honestly, the full cost structure surprises most operations managers the first time they see it.
Direct scrap is the obvious line item. If drift goes undetected for 6 hours on a line producing 200 parts per hour, and the last 3 hours of production were outside spec, you're looking at 600 parts to sort, quarantine, and disposition. At a typical machined aluminum component value of ¥800-2,000 per part, that's ¥480,000 to ¥1.2M in direct material cost before accounting for machine time or labor.
Rework cost multiplies that figure. Parts salvageable through secondary operations cost 40-60% of original production cost to rework, and rework introduces its own variation. Rework acceptance rates in precision machining rarely exceed 85%; the remaining 15% become scrap regardless.
Customer escapes are a different order of magnitude entirely. A confirmed escape to an automotive or aerospace customer typically triggers containment (100% inspection of field stock), a formal SCAR or 8D process, and in some contracts, financial liability for the customer's incoming inspection cost. We've seen single drift-driven escape events cost 3 to 5 times the value of the original production run when all downstream costs are included.
The most expensive drift events produce conforming parts by dimensional measurement but with degraded surface integrity or subsurface stress. Those failures show up in the customer's field data, not your in-process inspection records.
What Good Drift Monitoring Looks Like
Based on what we've built and deployed, a practical drift monitoring architecture has three layers.
- High-frequency process data capture: Spindle load, vibration envelope, motor current, and coolant data logged at 10-100 Hz. Not stored indefinitely, but buffered in a rolling 48-hour window with summarized statistics retained long-term.
- Statistical trending layer: Moving average and standard deviation calculated on a rolling basis, with configurable trend alerts that fire when the moving mean has shifted more than 30% of the tolerance band in a single shift, regardless of whether any individual point exceeded a control limit.
- ML correlation layer: A model trained on confirmed historical drift events maps the multivariate signature of known failure modes. New data streams are scored continuously. Alerts include probable cause and suggested first-response action.
The third layer requires investment in model training and a consistent feedback loop: when an operator confirms or dismisses an alert, that label becomes training data. The model improves over months of operation in ways that a static control chart never can.
Drift management isn't a solved problem. It's an ongoing practice. The shops that handle it well treat it as a continuous calibration of both the machines and the monitoring systems watching them. If you're still relying solely on end-of-batch dimensional inspection to catch drift, you're running 2-6 hours behind the process. That lag is where your scrap comes from.
We're happy to walk through how our process intelligence platform approaches drift detection for CNC environments. Reach out to our team if you want to see it on your machine data.